ANC-201 Exam Questions & Answers
Exam Code: ANC-201
Exam Name: Building Lenses, Dashboards, and Apps in Einstein Analytics
Updated:
Q&As: 209
At Passcerty.com, we pride ourselves on the comprehensive nature of our ANC-201 exam dumps, designed meticulously to encompass all key topics and nuances you might encounter during the real examination. Regular updates are a cornerstone of our service, ensuring that our dedicated users always have their hands on the most recent and relevant Q&A dumps. Behind every meticulously curated question and answer lies the hard work of our seasoned team of experts, who bring years of experience and knowledge into crafting these premium materials. And while we are invested in offering top-notch content, we also believe in empowering our community. As a token of our commitment to your success, we're delighted to offer a substantial portion of our resources for free practice. We invite you to make the most of the following content, and wish you every success in your endeavors.

Download Free Salesforce ANC-201 Demo
Experience Passcerty.com exam material in PDF version.
Simply submit your e-mail address below to get started with our PDF real exam demo of your Salesforce ANC-201 exam.
![]() Instant download
Instant download
![]() Latest update demo according to real exam
Latest update demo according to real exam
* Our demo shows only a few questions from your selected exam for evaluating purposes
Free Salesforce ANC-201 Dumps
Practice These Free Questions and Answers to Pass the Salesforce Consultant Exam
An Einstein Discovery team created a model to maximize the margin of their sales opportunities. They want to deploy the model to the Opportunity object in order to predict the outcome of every newly created or updated Opportunity.
What are the steps to accomplish this?
A. Create a trigger on Opportunity and use the Salesforce External Connector to get predictions from Einstein Discovery.
B. Create an Apex batch on Opportunity and use the REST API to get predictions from Einstein Discovery.
C. Create a trigger on Opportunity and install the Einstein Discovery Writeback managed package from the AppExchange.
D. Create a trigger on Opportunity and use the REST API to get predictions from Einstein Discovery.
A company used Einstein Analytics to create two datasets:
1.
"Opportunity With Account- dataset, which contains data from the Opportunity standard object
augmented by the Account data.
2.
"Case with Account" dataset. which contains data from the Case standard object augmented by the Account data.
The company wants to build a lens showing the total number of Opportunities and Cases per Account. How can a consultant help them build this lens'
A. Create a recipe to generate a new dataset from the "OpportunityWithAccount" and "CaseWithAccount" datasets aggregated by Account, and use the generated dataset in a lens.
B. Use "Compare Table" to join the "OpportunityWithAccount" and "CaseWithAccount" datasets using the "Accountld" and then aggregate by Account.
C. Set up Connect Data Sources in the UI between the "OpportunityWithAccount" and "CaseWithAccount" datasets.
D. Use a SAQL query to group and join the "OpportunityWithAccount" and "CaseWithAccount" datasets then generate the results.
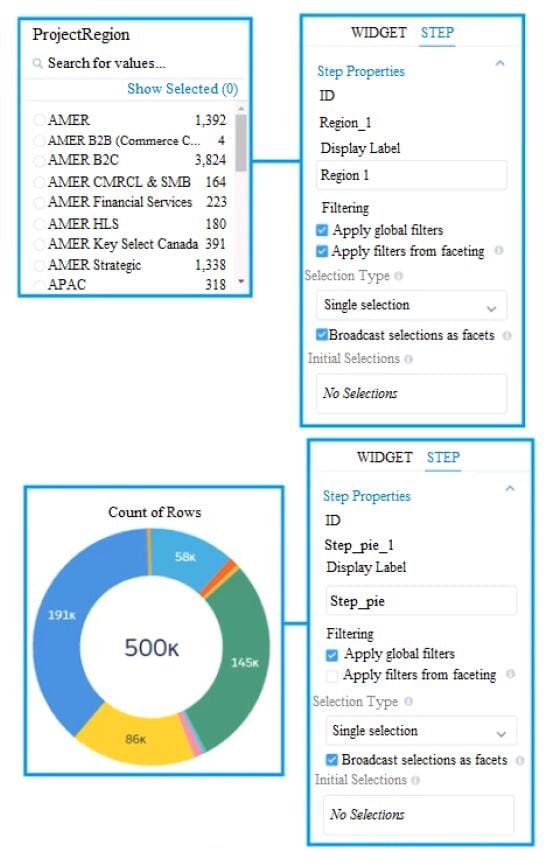
Universal Containers reports that any selection in the List widget is not affecting the Pie chart in one of their Einstein Analytics dashboards. The step options associated with the List widget and Pie chart are
shown in the graphic.

Which two changes can an Einstein Consultant implement to solve this issue, given that the steps are using the same dataset? Choose 2 answers
A. Use selection binding in the filters section of the step "Step_pie_1."
B. Enable the option "Apply filters from faceting" in the step "Region_1."
C. Enable the option "Apply filters from faceting" in the step "Step_pie_1."
D. Use selection binding in the filters section of the step "Region_1."
Philip adds a recently created Seed Bank Orders dataset to an Einstein Analytics app for which the Mosaic Seed Bank project team has the Viewer app role. How much data in the Seed Bank Orders dataset can a project team member see?
A. None of the data
B. Only rows designated by the Salesforce administrator
C. All rows and fields in the datasets
D. Only rows designated by the App Manager
An Einstein Analytics team created a funnel chart to show the number of opportunities in each stage. The managers who use the chart report that the funnel shows stages in alphabetical order instead of sales cycle order.
In which two ways can a consultant help them address this issue? Choose 2 answers
A. Use a dataflow to rename the stages with a preceding number.
B. Use a dashboard JSON to rename stages.
C. Use a dataflow to sort the stages by their internal name.
D. Use a dataset XMD to rename stages.
Viewing Page 1 of 3 pages. Download PDF or Software version with 209 questions

